Where to find it
- Open any post in the editor.
- On the top right side of the screen, click the Stats icon.
What the Stats panel does
Stats analyzes your draft and provides data-driven feedback so you can optimize your post before publishing. It looks at:1. Estimated Reach
Shows a prediction of:- impressions: approximately how many people may see your post
- engagement: expected interactions (likes, comments, reposts)
2. Readability
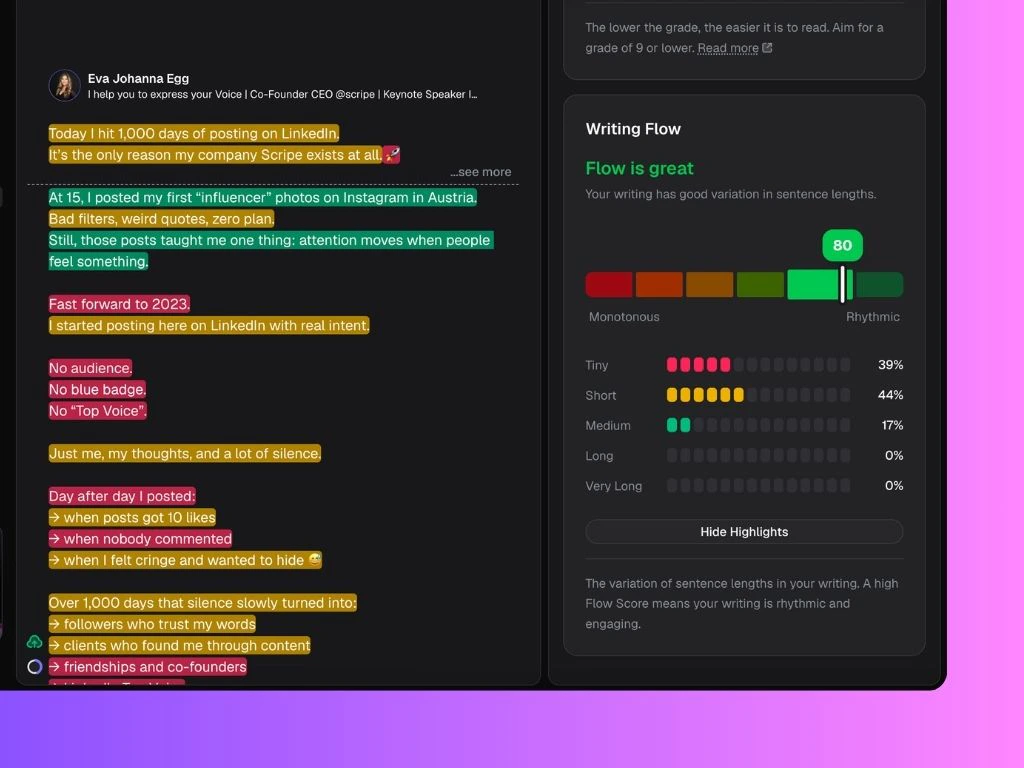
The readability score is calculated using the Flesch–Kincaid readability tests, a widely used method that evaluates how complex a text is based on sentence length and word difficulty. The lower the grade, the more accessible and conversational the text is. For LinkedIn, clearer writing typically performs better because readers can process the message quickly while scrolling. The result is a grade level (0 to 12) and we recommend that you aim for a grade of 9 or lower.3. Writing Flow
Shows the variation of sentence lengths in your writing. A high Flow Score means your writing is rhythmic and engaging. The panel breaks down your sentences into tiny, short, medium, long, and very long. A mix of shorter and longer sentences keeps readers engaged and improves rhythm. You can also click “Highlight sentence lengths” to see every sentence in your editor color-coded by length. This makes it easier to spot where you may need to shorten or vary your sentences.What the Stats panel does
Stats analyzes your draft and provides data-driven feedback so you can optimize your post before publishing. It looks at:1. Estimated Reach
Shows a prediction of:- impressions: approximately how many people may see your post
- engagement: expected interactions (likes, comments, reposts)
2. Readability
The readability score is calculated using the Flesch–Kincaid readability tests, a widely used method that evaluates how complex a text is based on sentence length and word difficulty. The lower the grade, the more accessible and conversational the text is. For LinkedIn, clearer writing typically performs better because readers can process the message quickly while scrolling. The result is a grade level (0 to 12) and we recommend that you aim for a grade of 9 or lower.3. Writing Flow
Shows the variation of sentence lengths in your writing. A high Flow Score means your writing is rhythmic and engaging. The panel breaks down your sentences into tiny, short, medium, long, and very long. A mix of shorter and longer sentences keeps readers engaged and improves rhythm. You can also click “Highlight sentence lengths” to see every sentence in your editor color-coded by length. This makes it easier to spot where you may need to shorten or vary your sentences.